An “African Swede” is Gone: Remembering Hans Rosling

I don’t really have idols. I have never asked anyone for an autograph. I don’t like the idea of following celebrities. But I do have a few people I truly admire and of them only a few have anything at all in common with me. However some special people, Swedes with a strong bond to Africa, inspire me in a unique way. Professor Hans Rosling was one of them, first mentioned on my blog in 2008 (writer Henning Mankell another). He very sadly passed away yesterday, on my birthday, taken violently by cancer.

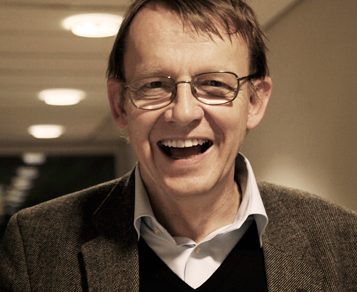
Photo: Stefan Nilsson, Gapminder. 

Through my sadness, I am thankful for his life and work, and I will remember Hans Rosling for:

  1. Making statistics sexy. His multidimensional videos on statistics are encouraging and educative and often tell the bigger picture story of that after all, the world is getting healthier, safer and fairer. See the video above for a great example. See link below for how to use Gapminder data in teaching.
  2. Pushing the World Bank, UN and other organisations to make their collected data a public good – free and available for all. This move is aligned with the Open Society and Access to Knowledge (A2K)  movements which seeks to openly share information to make the world a better place.
  3. Balancing being a successful academic with connecting to people. I recommend this recent article about Rosling and his work for a critical assessment of this impossible balance.
  4. Creating Dollar Street – an amazing resource to show us what economic conditions around the world really look like.
  5. Taking an active role in the Ebola crisis and a clear stand in the aftermath of the Syrian refugee crisis (see video below). What is the purpose of being wise if you never speak up?

I’d like to call Rosling and “African Swede”, because I think he had African qualities – he understood storytelling and embodied Ubuntu – “I am because you are”. 

More than once, I have been in conversations about bringing Hans Rosling to Ghana. Maybe Gapmider’s co-founders Ola and Anna will come instead and discuss Gapminder and the advantages with a fact based outlook?

So I seem to like educators and writers. Who do you admire?

Follow @gapminder on social media and checkout the website Gapminder /Gapminder for Teachers if you have not yet.

Continue Reading

You may also like

World Bank Does Good: Opens Free Data Website

On April the 20th 2010, the World Bank announced they would be making their statistics on development available on the Internet, free of charge. Before you needed to pay to have access to these data sets or buy a CD-ROM. At the same time a new website was opened to easily disseminate the information – data.worldbank.org (see pic).

The Swedish organization Gapminder has been working for some time now with making it happen and. In 2006, was lucky to work with one of their board members, Gun-Britt Andersson and was by her introduced to Gapminder’s mission of “unveiling the beauty of statistics for a facts based world view”. Since then, I have seen Director of Gapminder Hans Rosling’s TED speeches many times and played around with the data on their website.

Now even more data is available. Gapminder commented on the World Bank releasing some of its development data on its website calling it a “bold and long awaited step”.

Free statistics, what does it mean?

Well, to start out with, information is now available all over the world. All decision makers can now afford to inform themselves. Researchers and students can find more data to test theses and critique current data collection, indicators and methods. Developers can play around with the data and make it even more accessible. An app-competition is to be organized soon.

Read Owen’s blog and Privat Sector Development Blog for more info on its uses.

Faced with this statistical opportunity,  what did I do?

I first checked out the country page for Ghana. It was easy to overview, but unfortunately the additional indicators took a while to load. Still most recent information on GDP, GNI, Poverty, Literacy, Debt, Education, Infrastructure and Unemployment lay in front of me in seconds.

Second, I looked at topics. I was looking for migration, but as I couldn’t find it, I chose Education as I also have a research interest in Higher Education. As the page loaded, my first feeling was confusion. How can total enrollment be 106% for primary school?

After thinking about it for a while and realizing primary enrollment has dramatically increased over the last years , I can only think of one explanation. Is it because now also older students get a chance to catch up?

What else did I find?

For higher education I found two interesting indicators – enrollment on tertiary level and public expenditure on tertiary students per student as percentage of GDP per capita. For the first one, Ghana has 6,2% of an age group that officially corresponds to tertiary level enrolled in tertiary education. Sweden has 74,5%. Public expenditure on education, especially higher education is an interesting number, so why not give it to us in a more comparable format?The data can with a click be seen as a map instead of a table. The sets can also be saved or shared.

All in all, I recommend visiting this website. The data being released is long overdue – imagine the “open market” supporters clinging on to their own data! Actually, this information raises more questions than it answers which is a pretty awesome outcome.

Continue Reading

You may also like